Glossary#
Region and Realization#
Region Code: The code of the region, which is commonly an abbreviation of the region name. The region codes are SFBR for San Francisco Bay Region, LA for the Greater Los Angeles Region, NM for the New Madrid Seismic Region.
Region Name: The name of a seismically vulnerable geographic region of interest in the U.S. or around the world. Currently, San Francisco Bay Region is available as a region, and the Greater Los Angeles Region and New Madrid Seismic Region are two regions that will be included in the future.
Rupture Realization: A scenario refers to the earthquake that is modeled (e.g., Magnitude 7.0 Hayward fault event). Realizations refer to the multiple rupture models, which may differ by the slip distribution, rate, dip, strike, Ztor, and other rupture parameters, for the scenario earthquake. Rupture realizations are represented by the realization number and the code ‘patch’ indicating the incorporation of a deterministic patch. Currently 50 realizations are available for a magnitude 7.0 Hayward fault scenario ( 25 without patches and 25 with patches).
Fault Rupture#
Fault rupture parameters.#
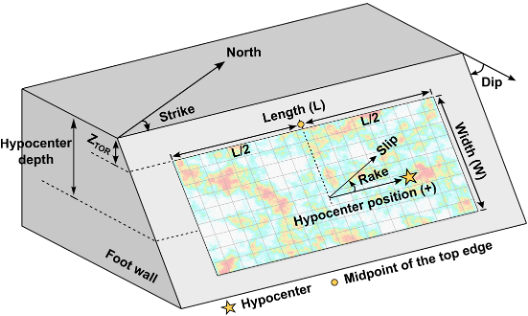
Center Latitude: Latitude of the midpoint (Please refer to Figure 1) of the surface projection of the top edge of the fault rupture.
Center Longitude: Longitude of the midpoint (Please refer to Figure 1) of the surface projection of the top edge of the fault rupture.
Dip: Please refer to Figure 1.
Fault Length (\(L\)): Please refer to Figure 1.
Fault Mechanism: Defines one of the fault types of strike slip, normal, or thrust.
Fault Name: Name of the quaternary fault that the scenario earthquake originates from.
Fault Width (\(W\)): Please refer to Figure 1.
Hypocenter Depth: Please refer to Figure 1.
Hypocenter Position: Please refer to Figure 1.
Magnitude: Magnitude of the scenario earthquake.
Rake: Please refer to Figure 1.
Rupture Geometry: Defines one of the options of a single planar fault segment or multiple planar fault segments.
Rupture Graphic: A visual graphic that displays the slip, slip-rate and rise time across the fault rupture.
Rupture Velocity Factor: The ratio of average rupture velocity to the local shear wave velocity of the geological material surrounding the fault.
Slip Characteristics: Defines one of the options of (a) stochastic spatial rupture slip features, (b) hybrid ruptures with combined stochastic and deterministic spatial slip features. The hybrid ruptures are designed to represent slip “patches” characterizing areas of enhanced seismic energy release which, depending on their depth, affect different frequency ranges.
Strike: Please refer to Figure 1.
\(\mathbf{Z}_{\text {TOR }}\): Please refer to Figure 1.
Simulation#
Max_freq (Hz): Maximum frequency resolved by the simulation.
Output spacing (m): Output spacing that provides the distance between the down-sampled grid points where ground motion data is available.
Surface grid spacing (m): Surface grid spacing that defines the distance between computational nodes at the free surface of the computational domain.
Velocity Model: The seismic velocity model utilized in the simulation (e.g., the USGS v21.1 velocity model for the sfbr region).
\(V_{s \mathrm{min}}\) (m/s): Minimum shear wave velocity resolved in the velocity model used for the simulation.
Station and Ground Motion#
Elevation: The vertical elevation of the station from sea level.
Latitude: Latitude of the station.
Longitude: Longitude of the station.
PGA (g), PGV (m/sec), PGD (m): The RotD50 peak ground acceleration, velocity and displacement. The RotD50 metric represents the median across 180 orientations of the horizontal ground motion rotated from \(1^{\circ}\) to \(180^{\circ}\) in \(1^{\circ}\) increments.
\(\mathrm{R}_{\mathrm{jb}}\) (km): Joyner-Boore distance, shortest horizontal distance from a station to the vertical projection of the rupture,
\(\mathrm{R}_{\text {rup }}\) : Closest distance from the station to the fault rupture,
\(\mathrm{R}_{\mathrm{x}}\) : Horizontal distance from the surface projection of the top edge of the fault rupture to the station.
PGA, PGV, PGD: RotD50 Peak ground acceleration, velocity and displacement. The RotD50 metric represents the median from the two horizontal components rotated across 180 orientations, ranging from \(0^{\circ}\) to \(179^{\circ}\).
\(\mathrm{V}_{\mathrm{s} 30}\) : The time averaged shear wave velocity to 30 m depth at the location of a given station.
Vs30_sim_model: Vs30 calculated at the location of the station after applying the minimum shear wave velocity to the adopted seismic velocity model.
Station Name: Name of the station where ground motion data is available in the database.
\(X\), \(Y\) : The 2D cartesian coordinates of the grid point in the computational domain. Definitions are provided for each region.
\(\mathbf{z 1}\) _0, z2_5: The depth at which the shear-wave velocity reaches \(1.0 \mathrm{~km} / \mathrm{s}\) and \(2.5 \mathrm{~km} / \mathrm{s}(\mathrm{Z} 1.0\) and Z2.5) at the location of the station.